Mermaid Diagram Customization Guide
Introduction
Mermaid is a JavaScript-based tool for creating diagrams and charts that uses Markdown-inspired text definitions and a renderer to create and modify complex diagrams.
Within this guide, we have prepared several basic diagrams that may be encountered in documentation.
Useful links
Note
This guide primarily describes color customization of diagrams. You can learn about the logic of building diagrams on the Mermaid website.
Basic conditions
- Mermaid diagrams are only applicable on yfm pages.
- Any insertion starts with
```mermaidand ends with```. - Each diagram is filled in separately.
Sequence diagram
Diagram screenshot

Code block
```mermaid
%%{
  init: {
    'theme': 'base',
    'themeVariables': {
      'primaryColor': '#4DA0FF',
      'secondaryColor': '#0667D8',
      'noteBkgColor': '#D3DCFD'
    }
  }
}%%

sequenceDiagram
    rect rgba(233, 237, 254, 1)
    note right of Alice: Alice calls John.
    Alice->>+John: Hello John, how are you?
    rect rgba(77, 160, 255, 1)
    Alice->>+John: John, can you hear me?
    John-->>-Alice: Hi Alice, I can hear you!
    end
    John-->>-Alice: I feel great!
    Alice ->>+ John: Did you want to go to the game tonight?
    John -->>- Alice: Yeah! See you there.
    end
```
Parameters for color customization:
'primaryColor'::— the color value for the diagram "actors" "Alice" and "John" and the lines connecting them. According to the design project, we specify'#4DA0FF'.'secondaryColor':— the color value for the blocks after the arrows. According to the design project, we specify'#0667D8'.'noteBkgColor':— the color value for marking blocks of the "Alice calls John" format. According to the design project, we specify'#D3DCFD'.rect rgba(233, 237, 254, 1)— the color value for the diagram background. The action is limited to the secondend.rect rgba(77, 160, 255, 1)— the color value for the dark blue block in the middle of the diagram. The action is limited to the firstend.
Flowchart
Diagram screenshot
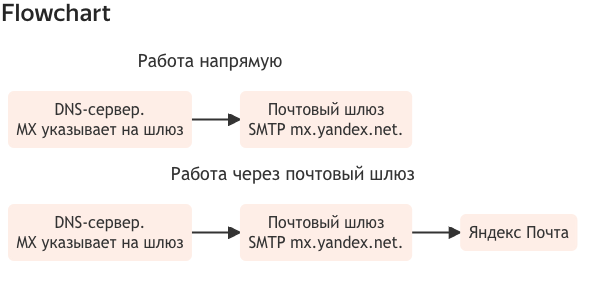
Code block
```mermaid
---
title: Работа напрямую
---
flowchart LR
%% Nodes
A("DNS-сервер.
MX указывает на шлюз"):::orange
B("Почтовый шлюз
SMTP mx.yandex.net."):::orange


%% Edges
A --> B

%% Styling
classDef orange fill:#FEEEE7,stroke:#FEEEE7,stroke-width:2px;
```
Parameters for color customization:
For each "set" of colors, you need to specify parameters in the line
%% Styling
classDef orange fill:#FEEEE7,stroke:#FEEEE7,stroke-width:2px;
Where:
orange— the text value for the color set that we define. The value can be anything.fill:— the color value for blocks with text. According to the design project, we specify#FEEEE7.stroke:— the color value for the block borders. According to the design project, we specify#FEEEE7.stroke-width:— the border width. According to the design project, we specify2px.
To assign the values of a color "set" to a specific element, specify the name of that "set". For example
A("DNS-сервер. MX указывает на шлюз"):::orange, where :::orange is the name of the color "set".
Entity Relationship Diagram
- Mermaid Documentation
- Mermaid Live Editor
- Template link - TBD
Diagram screenshot

Code block
```mermaid
%%{
  init: {
    'theme': 'base',
    'themeVariables': {
      'primaryColor': '#FF7F4D',
      'tertiaryColor': '#D3DCFD'
    }
  }
}%%

erDiagram
    CUSTOMER ||--o{ ORDER : places
    ORDER ||--|{ LINE-ITEM : contains
    CUSTOMER }|..|{ DELIVERY-ADDRESS : uses
```
Parameters for color customization:
'primaryColor':— the color value for the main blocks with text. According to the design project, we specify'#FF7F4D'.'tertiaryColor':— the color value for secondary blocks with text located on the arrows. In accordance with the design project, we specify'#D3DCFD'.
Mindmaps
Diagram screenshot
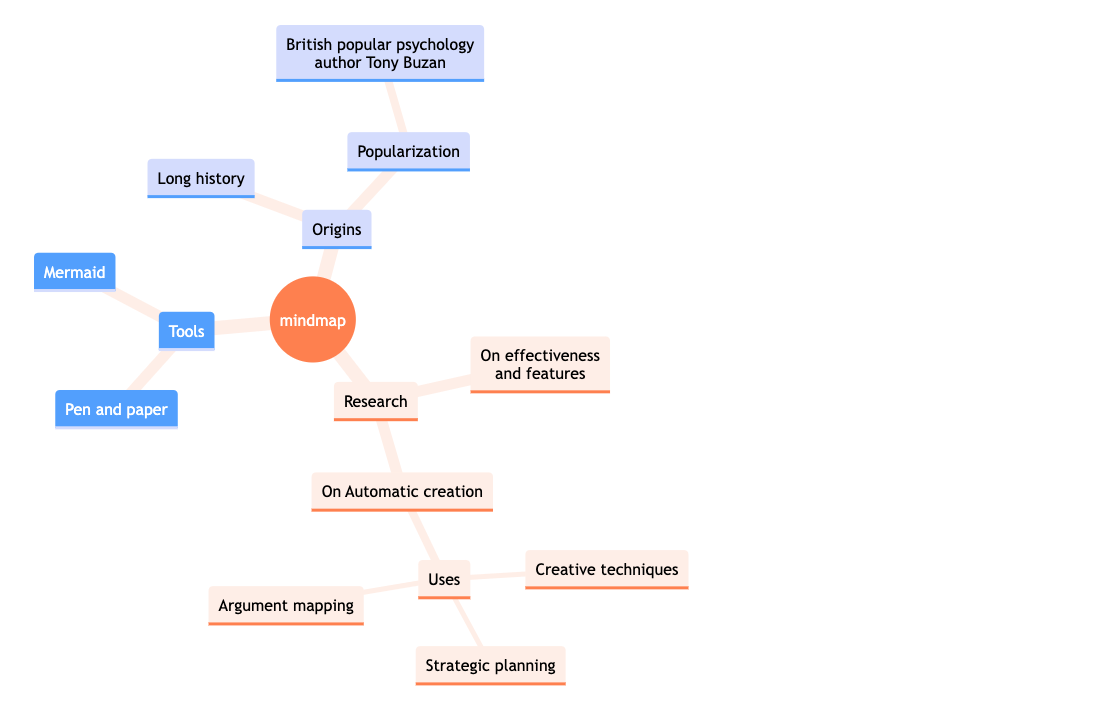
Code block
```mermaid
mindmap
  root((mindmap))
    Origins
      Long history
      Popularization
        British popular psychology author Tony Buzan
    Research
      On effectiveness<br/>and features
      On Automatic creation
        Uses
            Creative techniques
            Strategic planning
            Argument mapping
    Tools
      Pen and paper
      Mermaid
```
Note
Color customization of Mindmaps is done through custom CSS styles.
Block Diagram
Diagram screenshot
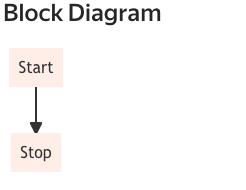
Code block
```mermaid
graph TD
A["Start"]
A --> C["Stop"]
style A fill:#FEEEE7,stroke:#FEEEE7,stroke-width:4px
style C fill:#FEEEE7,stroke:#FEEEE7,stroke-width:4px
```
Color values in this diagram are set for each individual block using a string of the form:
style A— the name of the block to be recolored.fill:— the color value for the block. In accordance with the design project, we specify#FEEEE7.stroke:— the color value for the block border.stroke-width:— the border width value. By default, we specify4px.
Note
Currently, Diplodoc supports diagrams of the "graph TD" type. If you specify "block-beta", as indicated in the documentation, the diagram will not be built.